
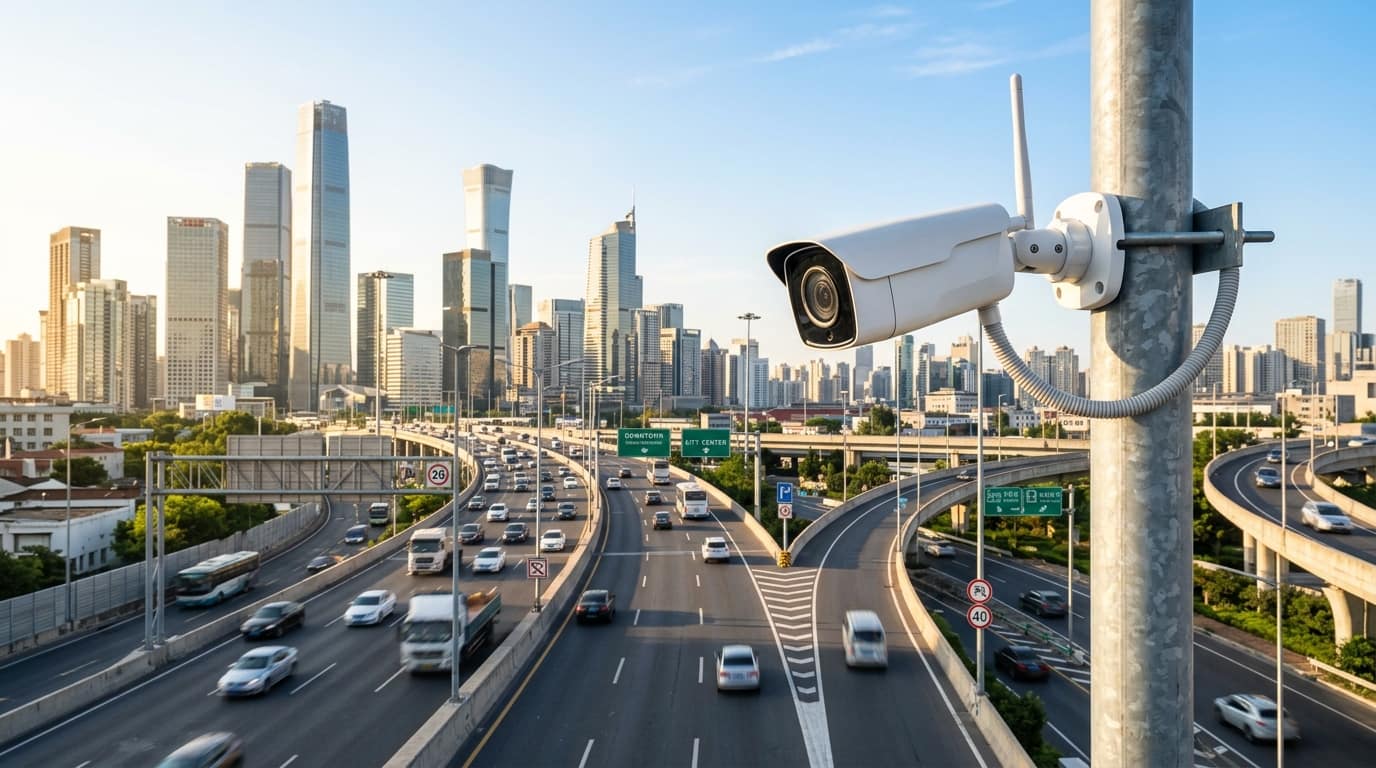
People counting and crowd analytics use overhead or angled cameras and AI software to count entries and exits, show live occupancy, map where people dwell and warn when density or queues cross a set limit. Accuracy for well-installed overhead counters is commonly above 95 percent, while crowd density estimates in dense scenes are approximate and should be treated as indicators.
At a glance
- Typical timeline
- Two to six weeks for a single site, depending on entrances and dashboard needs.
- Key standards
- ONVIF for cameras, IEC 62676 image approach, NBC 2016 Part 4 for occupancy limits as reference.
- What you receive
- Counting cameras, live dashboard, heat maps, alert rules, scheduled reports and test records.
- Best suited for
- Malls, retail chains, transport hubs, places of worship, events and public venues.
- Our scope
- Survey, camera placement, supply, installation, calibration, dashboard setup, training and AMC.
- Site survey
- Ceiling height, door width and traffic pattern checked at each counted entrance.
People Counting & Crowd Analytics Overview
People counting is the use of cameras and software to count how many people pass a line, and from that, how many are inside a space at any moment. Crowd analytics goes further. It estimates density in an area, builds heat maps of where people stand and walk, measures dwell time and queue length, and raises alerts when a threshold is crossed.
The same data serves different teams. A mall manager wants footfall by hour to plan staffing and measure marketing. A transport hub wants queue length at ticket counters to open another window. A temple trust or event organiser wants a live count against a safe capacity. A retail chain wants conversion, meaning how many visitors became buyers, compared across stores.
Counting is not new, but doing it accurately takes more than hanging a camera. Entrance width, ceiling height, lighting, shopping bags, prams, groups moving shoulder to shoulder and staff passing through all affect the count. A counter that is 90 percent accurate sounds fine until you realise that on a day with 20,000 visitors it is wrong by thousands, and the error is rarely evenly spread.
We approach counting as a measurement system with a known error. Each counted entrance is surveyed and calibrated against a manual count, and the result is written down. Our team, based in Nashik and serving Maharashtra, Gujarat, Madhya Pradesh and Rajasthan, sets up dashboards that show the error range honestly, so your managers know what the numbers can and cannot support.
Ideal for: Malls, retail chains, transport hubs, places of worship, events and public venues.
What Our People Counting & Crowd Analytics Includes
Our people counting scope covers the cameras, the calibration, the dashboards and the alerts your teams will act on.
Entry and exit counting and live occupancy dashboards
We install counters at each entrance, calibrate them and build dashboards by site, floor and zone. You receive calibration sheets and login roles. Tip: count at every entrance, since a missed side door breaks the occupancy figure for the whole building.
Heat maps and dwell-time analysis
We configure wide-angle cameras to build heat maps and dwell times for chosen zones, with date and hour filters. Tip: change one thing at a time in the layout, so the next heat map shows the effect clearly.
Overcrowding and queue-length alerts
We set density and queue thresholds, alert routes and escalation. You receive a threshold sheet agreed with operations. Tip: set a warning level well below the limit, so staff have time to act before it is reached.
Scheduled reports for operations teams
We schedule daily, weekly and monthly reports by email in PDF or CSV, with the metrics each team needs. Tip: keep the first report short, and add metrics only after people use it.
Staff filtering and data export
Where the hardware allows, we filter staff by height rule or a staff-lane layout and set up API or file export to your BI or retail tool. Tip: ask how staff are excluded, since staff movement can inflate counts in small shops.
Why manual counts and basic sensors give poor visitor data
Manual clicker counts are accurate for an hour and unreliable for a week. They cost staff time, miss peaks and give no data on where people go inside. Security guards estimate crowds by eye, and estimates vary widely between people and across the day. For a venue with legal capacity limits, an eyeball estimate offers weak protection if something goes wrong.
Older infrared beam counters count interruptions of a beam, not people. Two people walking side by side count as one, and a person who lingers in the doorway may count twice. They also cannot tell adults from children, staff from visitors or entry from exit in a crowded door. Data from such counters often fails to match till receipts, and managers stop trusting it.
Crowd safety is the harder case. Overcrowding builds gradually, and by the time it is visible to a guard, movement may already be restricted. Without live occupancy and density data, there is no early signal to close an entrance, redirect flow or open another exit. Queue problems are the same: the first sign is complaints, not a metric.
What You Gain
Reliable entry and exit counts
Overhead counting cameras count in both directions, separate groups and ignore objects like trolleys where properly set. Counts are calibrated against a manual sample and the error is recorded.
Live occupancy against a limit
The dashboard shows current occupancy per floor or zone against the limit you set. Alerts go to supervisors at say 80 percent and again at 100 percent, which gives time to act.
Heat maps and dwell time
Heat maps show which areas draw people and which are ignored. Dwell time shows how long visitors stay near a display or counter, which guides layout and staffing decisions.
Queue length alerts
Cameras count people in a queue zone and raise an alert when length or wait crosses a limit. Operators open another counter or redirect staff before complaints begin.
Staffing based on real footfall
Hourly and day-wise reports match staff rosters to demand. Cleaning, security and customer service can be planned for peaks, not averages.
Evidence for safety audits
Logged occupancy and alerts show that you monitored capacity during an event or festival. This record helps in safety reviews and with local authorities.
How the Work Is Delivered
Counting accuracy is won or lost at the survey and calibration stages. This is the sequence we follow.
- 1
Objectives and metrics workshop
We agree what you will measure: footfall, occupancy, dwell, queues or all of them. We decide the zones, the reporting frequency and who acts on the alerts. Metrics without an owner become unused dashboards.
- 2
Entrance and zone survey
We measure ceiling height, door width, lighting and traffic mix at each entrance. Overhead counters need a clear top-down view, and glass atriums or low ceilings may need a different camera type. We photograph each point and note staff routes.
- 3
Design and BOQ
We assign overhead counters to entrances and wide-angle cameras to density and queue zones. The BOQ lists cameras, a local processing unit or server, network and licences. You receive a layout drawing and an expected accuracy statement.
- 4
Installation and cabling
Cameras are fixed at the surveyed height and centred over the door, with a level mount, since tilt biases counts. PoE cable runs stay within 100 m, and power for server units comes from a protected supply.
- 5
Calibration against manual counts
We count manually for set periods at each entrance, compare with the system and adjust the counting line and filters. The calibration sheet shows the error per entrance, and we repeat the test at a busy hour.
- 6
Dashboard, alerts and reports
We build dashboards by site, floor and zone, set occupancy and queue thresholds, route alerts to named supervisors and schedule daily and weekly reports. Staff and visitor filters are set if the camera supports them.
- 7
Training, handover and AMC
Operators and managers are trained on reading the data and its limits. You receive calibration sheets, as-built drawings and credentials. AMC covers lens cleaning, recalibration after layout changes and software updates, with terms agreed per site.
Counting cameras and density estimation, and where each fits
For entrance counting, an overhead camera looks straight down at the doorway and tracks each head crossing a virtual line, which avoids the occlusion that side views suffer from in crowds. Stereo or depth cameras separate people from objects and handle height filters, useful to exclude children or trolleys when needed. Mounting height usually sits between about 2.5 and 6 m, and each model has a stated door width it can cover, so wide entrances need several units side by side.
For crowd density in halls, plazas or queues, software estimates the number of people in a zone from a wide camera view. In sparse scenes it can count individuals. In dense crowds, where bodies overlap, it estimates density and should be read as an indicator with a margin, not an exact head count. Heat maps are built by accumulating tracked positions over time. We state in writing which feature is a count and which is an estimate.
NBC 2016 Part 4 as an occupancy reference
The National Building Code of India Part 4 deals with fire and life safety, including occupant load and exits. We use its principles as a reference for setting alert limits, but the legal capacity of your building is set by your approvals and the authority.
ONVIF for interoperability
ONVIF conformant cameras let counting data and video flow into your VMS or dashboard from different makers. We verify support for the event types you need.
Mounting height and coverage rule
Each counter is specified for a mounting height range and a maximum door width. We design to those limits and add units for wide entrances, instead of stretching one camera beyond its rating.
BIS CRS registration for cameras
CCTV cameras in India need Bureau of Indian Standards registration. We supply registered models and share the references.
Privacy and data minimisation
Counting needs no identity. We configure aggregate counts only, avoid face storage and set retention. Where video is also recorded, the Digital Personal Data Protection Act 2023 applies to you as the operator.
Worked example: footfall and occupancy for a three-floor shopping mall
Consider a city mall with four public entrances, three floors and a food court. The management wants hourly footfall by entrance, live occupancy for the food court, and a queue alert at the parking exit. Entrances range from 2 m to 8 m wide, with ceilings of about 4 m at the doors and a glass roof over the central atrium.
We would fit overhead counters over each door, using several units side by side on the 8 m entrance, and exclude the atrium from overhead counting because of daylight washout. The food court would use a wide-angle camera with a density zone and a limit tied to seating and exit capacity. The parking exit would get a queue zone with an alert at a set length. All data would flow to a dashboard with floor and entrance views.
After calibration, the client typically sees counts that match a manual sample within a few percent at the doors, a reliable hourly profile for staffing, and food court alerts that match what managers see on weekends. Management then uses the heat maps to rework a poorly performing corridor, a decision that was guesswork before.
- Hourly footfall per entrance, within the recorded calibration error.
- Live food court occupancy with alerts at set percentages.
- Queue alert at the parking exit to call extra staff.
- Weekly report that links footfall to staffing and layout choices.
This is an illustrative scenario built from typical site conditions. Actual quantities, timelines and results depend on your site survey.
People Counting & Crowd Analytics Across Four States
We are based in Nashik and deliver across Maharashtra, Gujarat, Madhya Pradesh and Rajasthan. Each state has its own utilities, approvals and site conditions, and these are the points that matter most for this service.
Maharashtra
Maharashtra venues include large malls, railway and bus hubs, temple towns and festival crowds such as those at Nashik during the Kumbh Mela period. Peak days can be many times a normal day, so we size alert limits and server capacity for the peak and set a warning level well below the safe limit.
Gujarat
Gujarat sees heavy footfall at malls, textile markets, religious sites and festival events such as Navratri grounds. Evening peaks are sharp and short, so queue and density alerts must be fast. Open-air venues add sun glare and dust to the camera problem, and we review mounting direction against the sun path.
Madhya Pradesh
Madhya Pradesh has pilgrimage towns, government campuses, railway stations and growing malls. Fair and pilgrimage days bring dense crowds in open areas, where density figures are estimates and not exact counts. We set conservative limits there and agree who acts on an alert, with the local authority's crowd plan in mind.
Rajasthan
Rajasthan footfall centres on tourist forts, bazaars, heritage sites and fairs, with large seasonal peaks. Outdoor counting faces strong sun, shadows and heat, so overhead mounting and shaded housings matter. Heritage sites often restrict drilling, so we plan clamp-based or freestanding mounts and agree them with the site owner early.
Where This Work Is Most Often Needed
Why Teams Work With Us on This
Calibrated, not assumed
We count by hand at each entrance, compare with the system and give you the error figure. Your managers know how far to trust each number.
Counting that connects to access and CCTV
We also install CCTV, access control and fire systems. Occupancy limits can link to turnstiles and alarms, and the counting cameras can double as general views where suitable.
Local team for recalibration
Shops move displays and venues change layouts. We can mobilise from Nashik to revisit and recalibrate after a layout change, planning the visit with other work in your area, which keeps data meaningful.
Honest about estimates
We separate exact counts from density estimates in the report and the dashboard labels. You will not find a dense-crowd estimate presented as a head count.
Guides and Projects Related to This Service
Frequently Asked Questions
01How accurate is people counting?
Well-installed overhead counters commonly reach 95 percent or better on clear entrances, and accuracy falls with wide doors, strong sunlight, large groups and poor mounting. Ask for a calibration against manual counts at your own doors. We record the error per entrance and repeat the test at a busy hour.
02Can the system tell customers from staff?
Partly. Depth cameras can filter by height, and staff-only doors or lanes can be excluded. Some systems use staff tags or uniform detection. No method is perfect, so we explain the method and its error before you rely on conversion figures. Dedicated staff entrances make the problem much simpler.
03How much does a people counting system cost?
Cost depends on the number and width of entrances, camera type, any server or local processing unit, dashboard licences and whether you need density analytics or only door counts. A single-door counter is modest, while a multi-floor venue costs more. We price after a survey, with a line-item BOQ.
04What is the difference between people counting and crowd analytics?
People counting measures how many cross a line, giving footfall and occupancy. Crowd analytics estimates density, queues, dwell time and movement in an area. Counting needs overhead cameras at doors, while crowd analytics uses wide views of zones. Many projects use both, and we label which numbers are counts and which are estimates.
05Does it identify individuals?
No, counting and density analytics work on anonymous shapes and movements and do not need faces. We configure aggregate data only and keep retention short. If you also record video, privacy duties under the Digital Personal Data Protection Act 2023 apply to you, and we help with the technical settings.
06Can it warn us before a venue gets overcrowded?
Yes, live occupancy and density thresholds can send alerts at levels you choose, such as 80 percent and 100 percent of the safe limit. The alert is only useful with a plan, so we help define who closes a gate, who redirects flow and who informs management.