
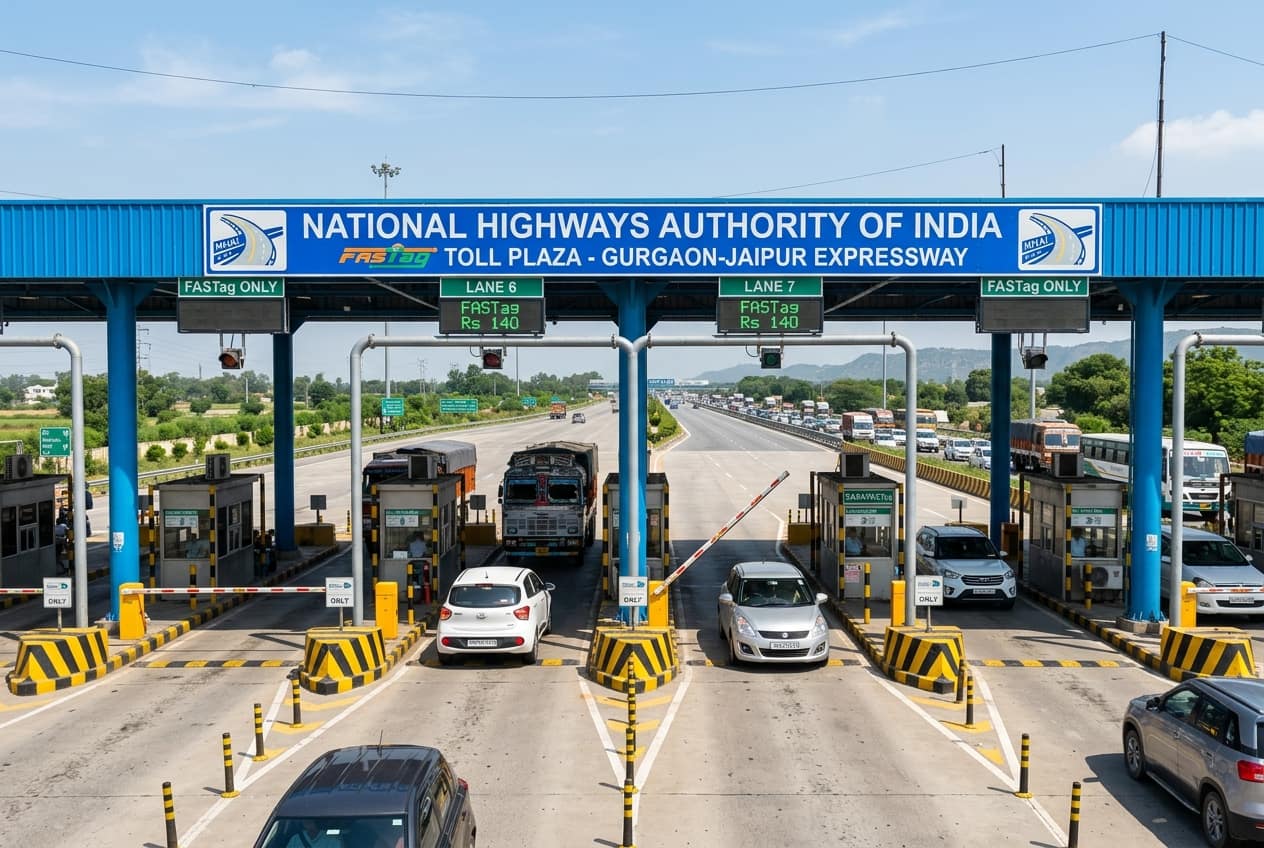
A toll plaza with too few lanes builds queues at the peak hour, and a plaza with too many costs more to build, equip and maintain than it needs to. The core of the decision is one short calculation: how many vehicles arrive in the busiest hour, how long each one occupies a lane, and how full you are willing to let each lane become. This guide works through an example you can repeat with your own traffic count.
Key Engineering Takeaways
- Lane capacity in vehicles per hour is 3,600 divided by the average service time in seconds.
- Design for a utilisation of about 70 to 80 percent, because queues grow very fast as a lane approaches full use.
- Separate electronic collection lanes from lanes that handle cash, exceptions and special vehicles.
- Use measured service times from similar plazas. The figures here are planning assumptions, not standards.
Step 1: Get the peak hour traffic
Start with a traffic count by direction and by hour, split by vehicle class where possible. The busiest hour of a normal working day is the design hour. Using the yearly average daily traffic alone hides the peak, and the peak is what creates the queue.
Our example has 1,800 vehicles per direction in the peak hour. Assume 95 percent carry a working FASTag, which gives 0.95 x 1,800 = 1,710 electronic transactions, and 90 vehicles that need another way to pay or to be resolved.
Step 2: Estimate how long a vehicle occupies a lane
Service time is the time from one vehicle entering the lane to the next being ready. For a lane with an RFID reader and an automatic barrier, assume 6 seconds as a planning figure, which includes the reader, the check against the back office and the barrier cycle. Real values vary with reader placement, vehicle speed and the quality of the tag. For manual or exception lanes, assume 25 seconds.
Capacity per electronic lane is 3,600 / 6 = 600 vehicles per hour. A manual lane is 3,600 / 25 = 144 vehicles per hour.
Step 3: Apply a design utilisation
A lane that is used 100 percent of the time has no spare capacity for a slow vehicle, a tag read failure or a driver who stops to ask a question. Queues then grow without limit. Design for 75 percent instead. An electronic lane then handles 600 x 0.75 = 450 vehicles per hour in practice, and a manual lane handles 144 x 0.75 = 108.
Electronic lanes needed: 1,710 / 450 = 3.8, so 4 lanes. Manual and exception lanes needed: 90 / 108 = 0.83, so 1 lane. The plaza needs 5 lanes in this direction.
Checks the simple model does not cover
- Growth: apply the traffic growth rate for the concession period, and leave civil space for another lane.
- Heavy vehicles and oversize loads occupy lanes longer, and may need a dedicated wide lane.
- Tag failures: plan how an exception vehicle is moved out of the electronic lane without blocking it.
- Concession terms: many agreements set a maximum waiting time or queue length. Check the contract, and size lanes to meet it.
- Reversible lanes: lanes that can switch direction help where traffic is heavy in one direction in the morning and the other in the evening.
Equipment and systems per lane
Each electronic lane needs the reader and antenna, a vehicle detector or loop, an automatic barrier, a lane controller, a canopy display and a camera for vehicle images. All lanes connect to a plaza server and then to the central system. The count of lanes drives the count of every one of these items, so a one lane error in the design repeats across the bill of quantities.
Conclusion & Next Steps
A lane count is only as good as its inputs. Get a proper traffic count, state your service time assumptions, apply a utilisation limit and write the result into the design report. We prepare this calculation as part of a toll lane design, and we compare it with measured service times from commissioning so the assumption can be corrected with real data.
Need a site survey or project quote?
Our engineers provide comprehensive BOQs, system designs, and turn-key execution across Maharashtra and neighboring states.
Related services
Want this done at your site? These pages explain the scope, the process and the standards we work to.